
Lab 2
Setup the IMU
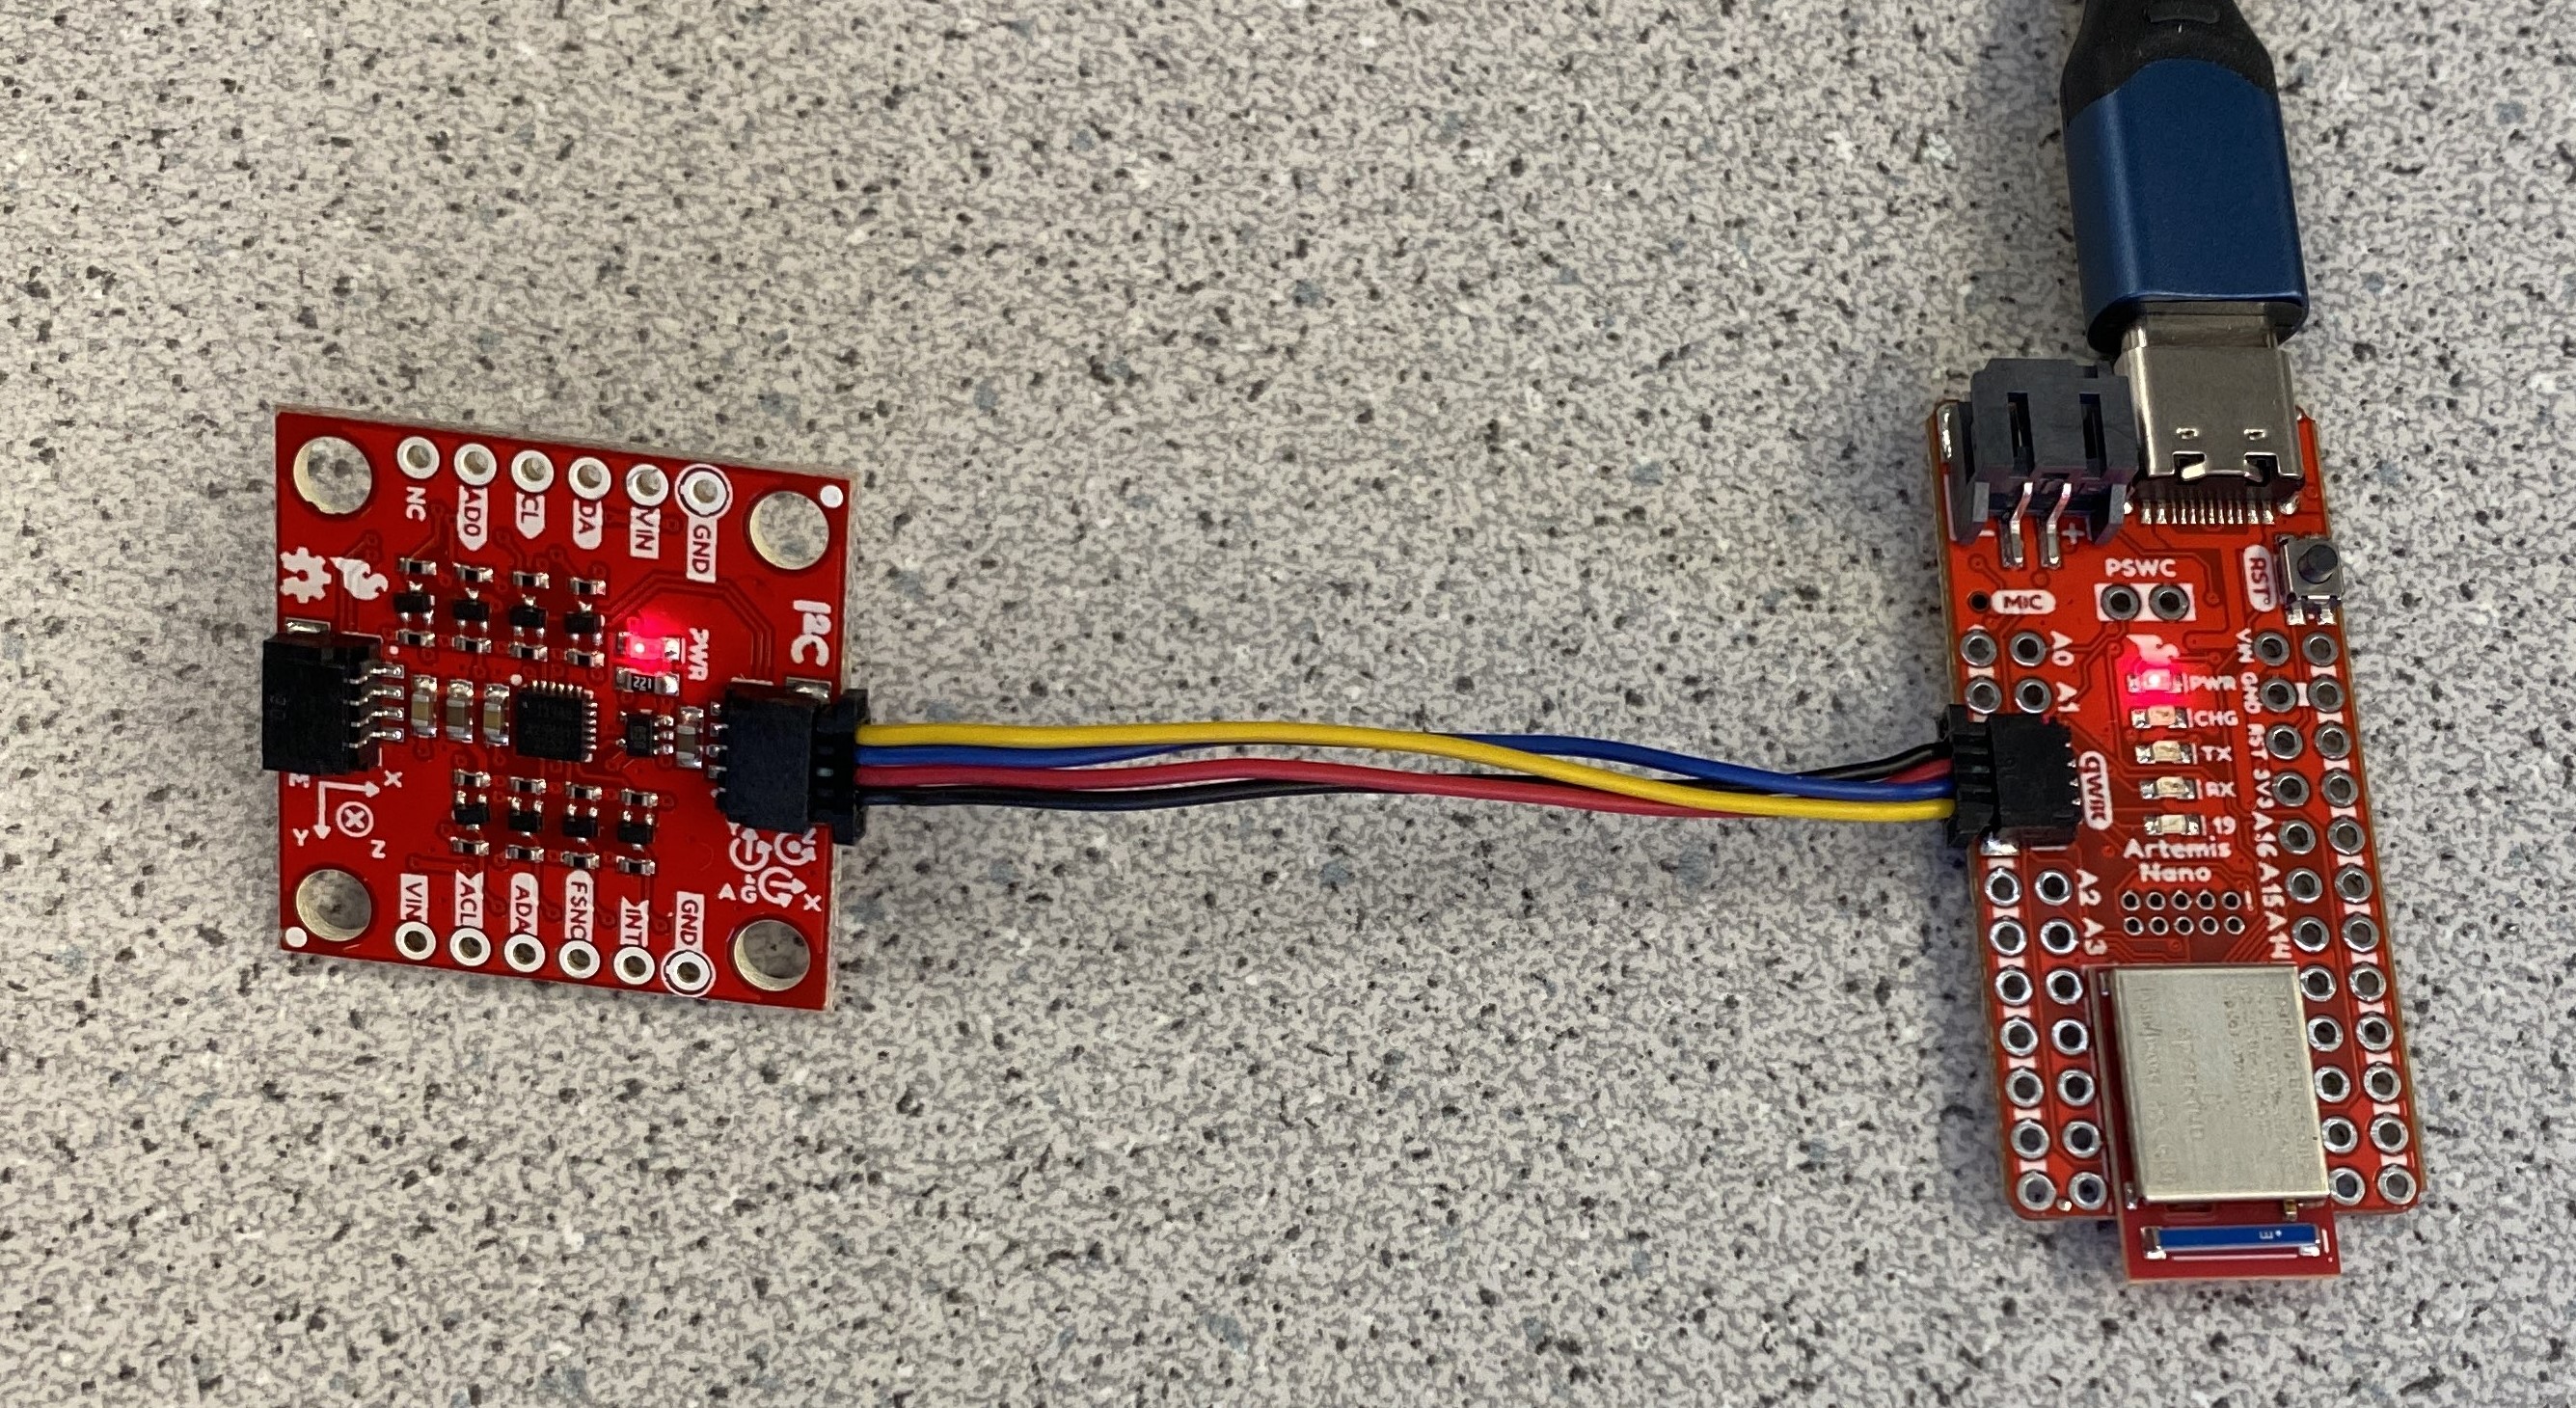
First, I connected the IMU to the Artemic Nano using the QUIIC connector, as shown in Figure 1.
Then, I pushed the Example code for the IMU Library. As expected, moving the gyroscope and accelerometer around changed the recorded values, as shown by the videos below (enlarge the video to see the values). The gyroscope raw data consists of the rate of rotation; so if the IMU is not moving, the rate of rotation is zero, and therefore the gyroscope raw data is a 0. How the values change based on the rotation are described in the first video below.
When placed on a flat surface, the accelerometer raw data shows a high z-value and zero x- and y-values. This is due to the accelerometer measuring the acceleration due to gravity. The motion of the accelerometer and its correlation to the raw data is explained in the second video below.
In this Example01_Basics code, the AD0_VAL is an important variable that allows the user to change the last bit of the device's I2C address. This is especially useful when we are working with multiple IMUs and want to communicate with the IMUs using I2C. Currently, it is set to 1 since there is just one IMU, but if we add another IMU, that IMU's AD0_VAL should be changed to 0 so its address is different.
Accelerometer
In order to calculate the pitch and roll of the IMU using an accelerometer, I used the following equations:
pitch = atan2(myICM.accX(), myICM.accZ())*180/M_PI;
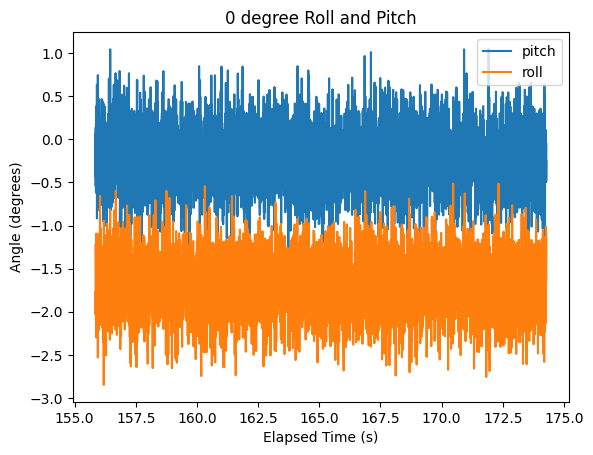
roll = atan2(myICM.accY(), myICM.accZ())*180/M_PI;First, I started out by ensuring that my notification handler and arduino code were written properly, and I transmitted around 20 seconds of data through the use of an array. In this case, I kept my IMU at 0 degrees roll, pitch, and yaw. Below, we see that my code is easily able to transmit over 5 seconds of code through Bluetooth, as required for this lab. We do notice quite a bit of noise, which will be filtered out in later parts.
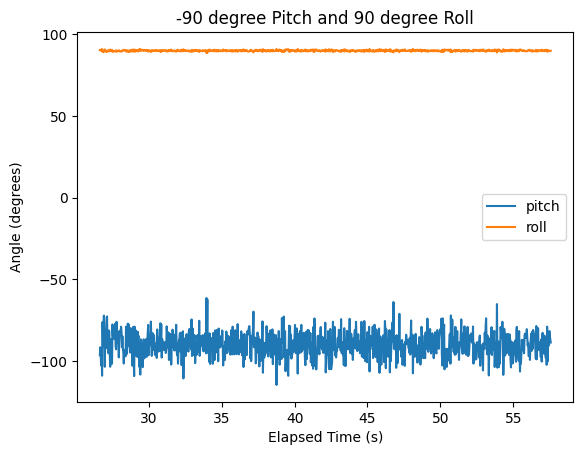
Next, I graphed the case where the IMU records a pitch of -90 degrees and a roll of +90 degrees. The resuting graph is shown in Figure 3. We see significantly more noise when calculating the pitch.
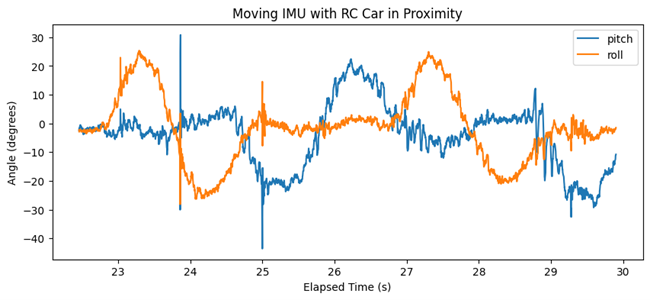
It is noticable that the accelerometer has a lot of noise; this is exacerbated with the addition of the RC car. Thus, I implemented a low pass filter, through first gathering some data of the IMU when it is in proximity with the RC car. I moved the IMU to generate roll and pitch, as shown in Figure 4.
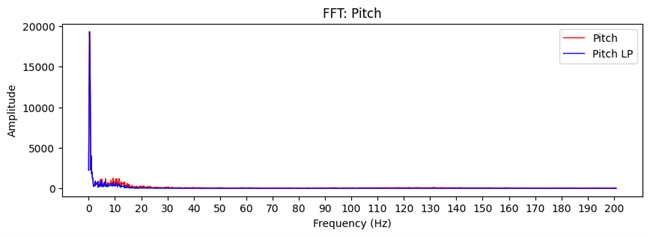
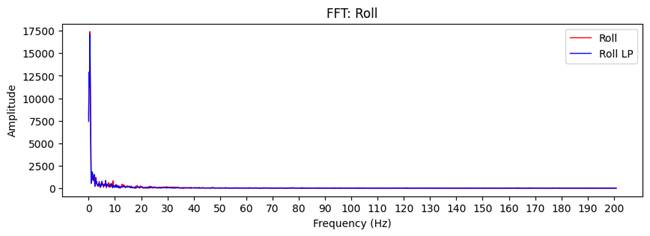
I then generated the frequency response through FFTs, which I used to calculate a cutoff frequency for the Low Pass Filter.
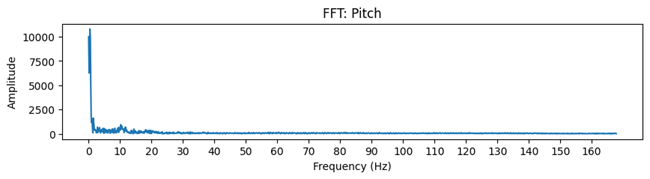
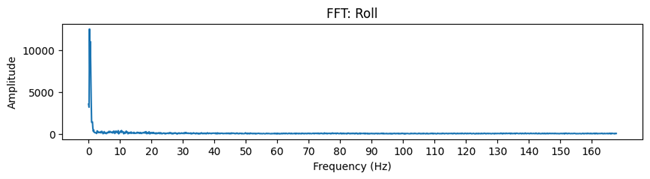
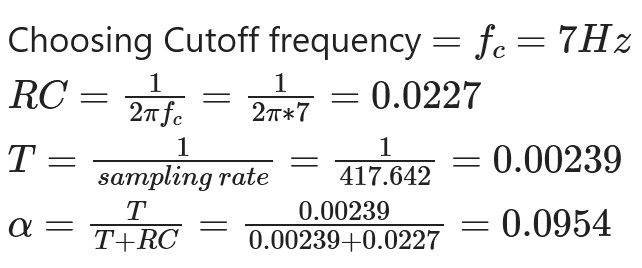
From this FFT data, I chose a cutoff frequency of 7Hz and found the alpha coefficient for the LP Filter.
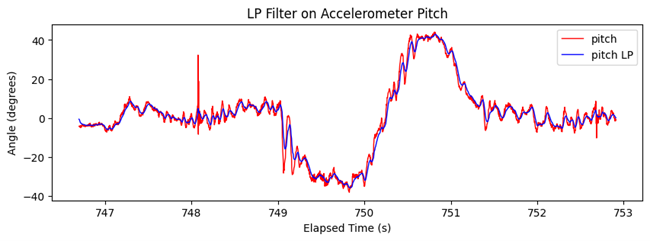
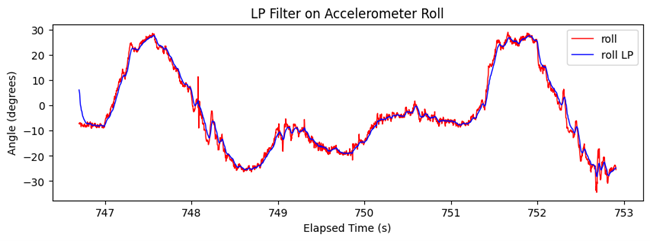
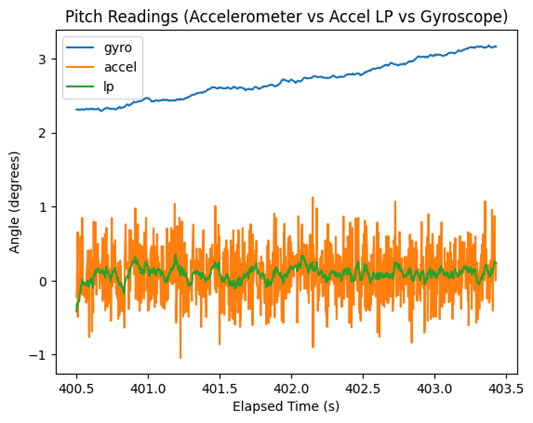
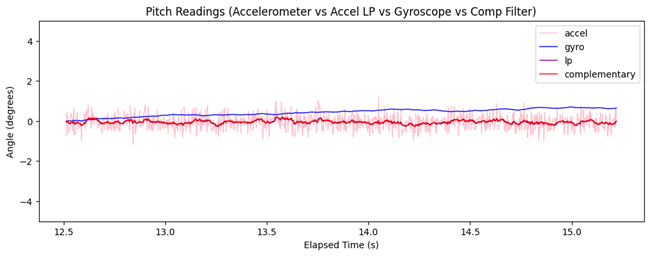
I set the alpha coefficient in the Arduino code and transferred the IMU data collected with and without the filter over Bluetooth. Then, I plotted the results, which are shown below. It is seen the the LP Filter decreased the noise in the accelerometer data collected as it decreased the frequency content above the cutoff frequency.
My Arduino code to store the pitch and roll values in GET_ACCEL_LOW_PASS_DATA is shown below.
case GET_ACCEL_DATA_LOW_PASS: {
	float alpha = 0.0954;
	for(int i = 0; i < MAX_CNT; i++) {
		if(myICM.dataReady()) {
			myICM.getAGMT();
			pitch = atan2(myICM.accX(), myICM.accZ())*180/M_PI;
			roll = atan2(myICM.accY(), myICM.accZ())*180/M_PI;
			roll_arr[i] = (float)roll;
			pitch_arr[i] = (float)pitch;
			time_arr[i] = (float)millis();
			roll_LP_arr[i] = alpha*(roll_arr[i])+(1-alpha)*(roll_LP_arr[i-1]);
			roll_LP_arr[i-1] = roll_LP_arr[i];
			pitch_LP_arr[i] = alpha*(pitch_arr[i])+(1-alpha)*(pitch_LP_arr[i-1]);
			pitch_LP_arr[i-1] = pitch_LP_arr[i];
		}
	}

	// ommiting code to transmit data over bluetooth

	break;
}
Gyroscope
In order to calculate the pitch, roll, and yaw of the IMU's gyroscope, I used the following equations:
dt = (micros()-last_time)/1000000.;
last_time = micros();
pitch = pitch + (myICM.gyrY()*dt);
roll = roll + (myICM.gyrX()*dt);
yaw = yaw + (myICM.gyrZ()*dt);
After setting up the notification handler and adding another command for gyroscope data, I collected some data. Figure 13 shows the drift that occurs in the gyroscope, as I set the gyroscope on a flat surface at 0 degree pitch, roll, and yaw.
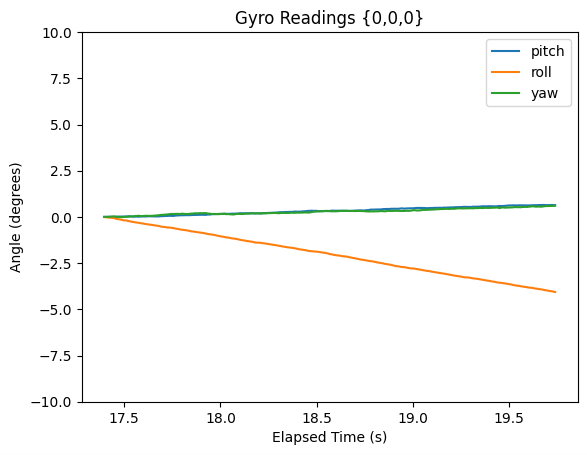
If we set the gyro in motion, there is noticably less noise as compared to the accelerometer, although there is still drift.
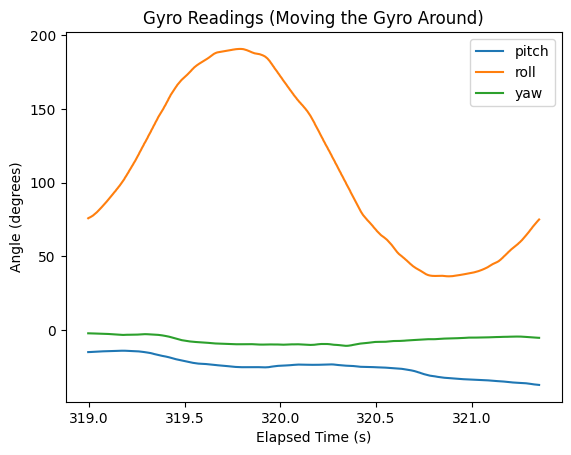
The yaw values are unique to the Gyroscope, as the accelerometer cannot measure the angle about the z-axis due to gravity constantly acting upon it.
Accelerometer vs Gyroscope Comparison
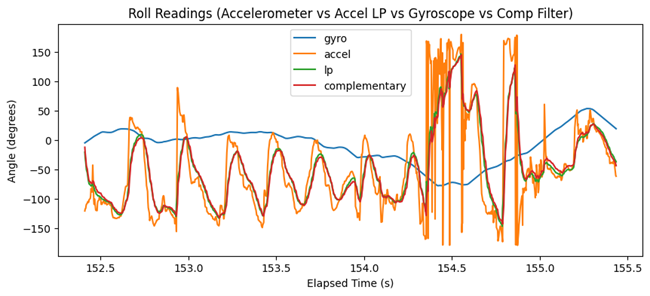
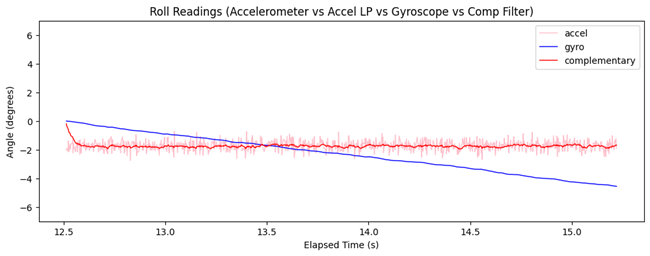
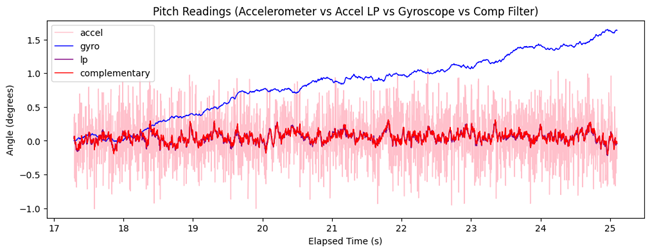
Let's see how the values collected from the Accelerometer and the Gyroscope differ. I placed an IMU on a flat surface and measured the pitch and roll from a gyroscope and an accelerometer. The results are shown in Figures 15 and 16. There is a clear drift in value from the gyroscope, and the raw accelerometer data (accel) is very noisy. The LP filter on the accelerometer does decrease the noise, but the gyroscope still has the least noise.
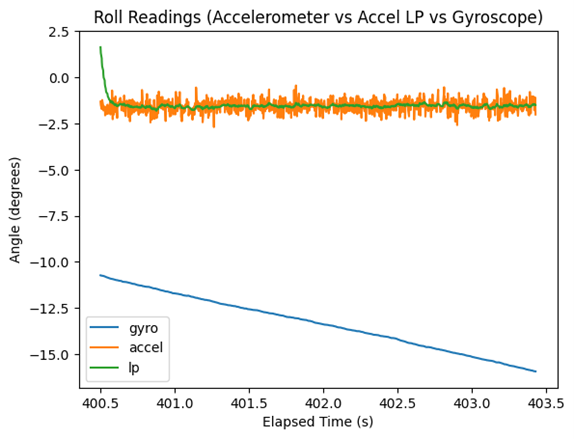
Note that the rate of change of the roll readings from the gyroscope was decreasing significantly faster. This could be an intrinsic property of the IMU that I worked with.
Adjusting the sampling frequency impacted the the pitch, roll, and yaw as the values became much more noisy and unpredictable. In the gyroscope data, the rate of change of the drift increased. Thus, decreasing the sampling frequency decreases the accuracy of the measurements and a high sampling frequency should be preferred.
Complementary Filter
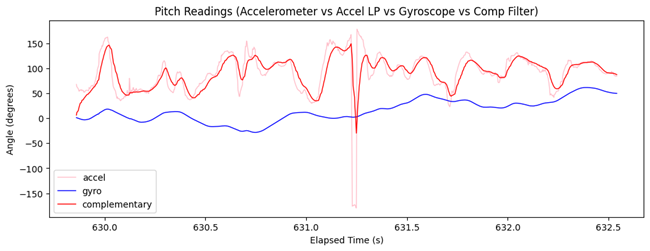
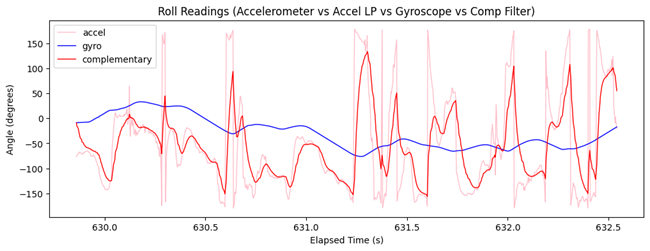
In the next set of figures, I show multiple sets of pitch and roll values collected using the accelerometer, the gyroscope, and the complementary filter. Overall, the complementary filter proved to work quite well as it didn't result in quick, unpredictable changes and it did not result in drift. Thus, the complementary filter produced superior results for measuring angles.
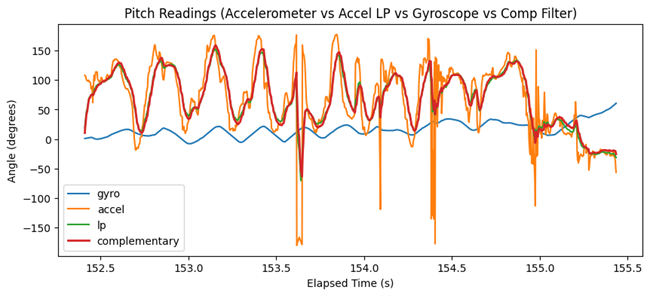
The equation used to calculates the pitch and roll using the complementary filter were:
roll_c_arr[i] = (roll_c_arr[i-1] + (myICM.gyrX()*dt))*(1-alpha) + alpha*roll_a;
pitch_c_arr[i] = (pitch_c_arr[i-1] + (myICM.gyrY()*dt))*(1-alpha) + alpha*pitch_a;
In terms of design choices, I chose to store my values in an array and use a notification handler to receive all values at the same time to ensure that I can have a high sample rate. This was also not a time intensive application so my method worked well.
Sample Data
As described by the lab handout, I ensured that I didn't have any unnecessary delays or print statements in my Arduino code to ensure that the IMU data was sent as fast as possible. From Figure 7, a sample was collected every 0.00239 seconds, so at a rate of 417 samples/second.
The main loop on Artemis does run faster than the IMU produces value although in our case the loop waits for the IMU to get data, so this is not an issue.
Time-Stamped IMU Data
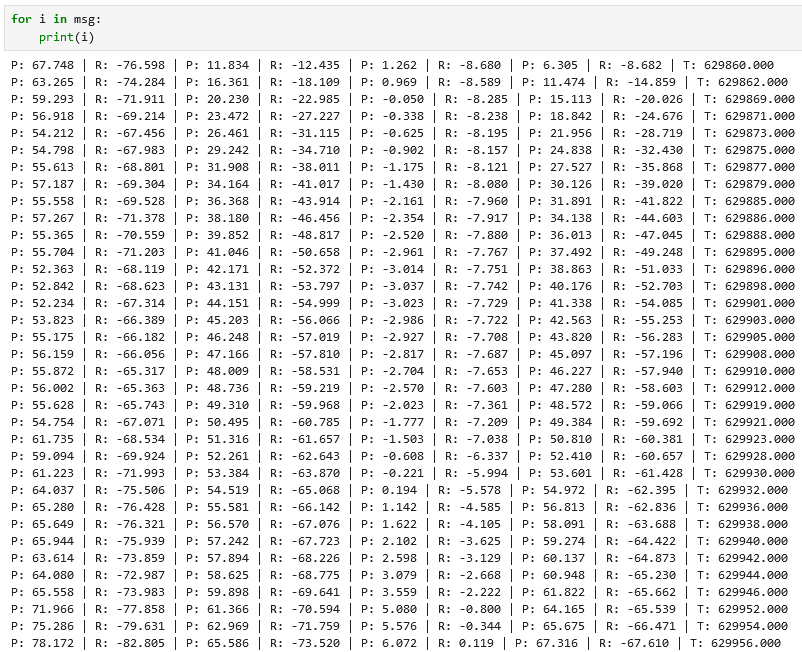
The figure below shows the time-stamped IMU data that was collected and then parsed by the notification handler in Jupyter notebook.
Data Storage
To me, it makes sense to have separate arrays to store accelerometer and gyroscope data. This is because it allows for the code to be cleaner and more understandable for readers. If both values were stored in one array, it would call for more indexing logic, which can be difficult to understand.
I think that integer and floats are the best data types for storing data. Obviously, the data type to use largely depends on the application, but integers and floats are 32-bits in size and so they generally fit for various purposes. In the case that we need to store a larger size of data, double could be chosen, and if we need to store a string of characters, String could be chosen as the data type.
My global variables used up 155864 bytes so far out of the total possible 393.216KB. In the global variables, I stored 10 float arrays of size 2500 each. Each array can therefore consume 39.32KB of allocated memory. At a rate of 417 samples/second = (417 * 4 bytes)/second = 1.668 KB/second, this corresponds to 39.32/1.668 = 23.57seconds worth of data.
Data Over Bluetooth
The x-axes in the graphs below demonstrate that my implementation is able to send over 5 seconds of data over Bluetooth since they show the elapsed time. In this case, I transmit over 7 seconds of data. The pitch and roll data were transmitted together, but they have been shown as two separate graphs for readability.
Record a Stunt
I had a lot of fun playing with this car (I'm really bad at recording and controlling the car at the same time though ;( ). One important thing to notice was that the car was difficult to control properly. At points, it would go out of control and also could not continue in a straight line. The video below shows my stunt!
References
I used Mikayla Lahr's lab report as a reference to check my graphs (https://mikaylalahr.github.io/FastRobotsLabReports/startbootstrap-resume-master/dist/index.html). I used Geek2Geeks for miscellaneous plotting Python details.